Introduction to Reverse Engineering with radare2 Cutter
Part 1: Key Terminology and Overview
Tuesday 23rd October 2018
Cutter is an open-source graphical user interface for the radare2 reverse engineering framework. This article contains an introduction to reverse engineering with Cutter, including key terminology and an overview of the Cutter interface and available tools.
This is part 1 of a 3 part series on reverse engineering with Cutter:
- Part 1: Key Terminology and Overview (You Are Here)
- Part 2: Analysing a Basic Program
- Part 3: Solving a Crackme Challenge

The Cutter logo.
Cutter can be found on GitHub here: https://github.com/
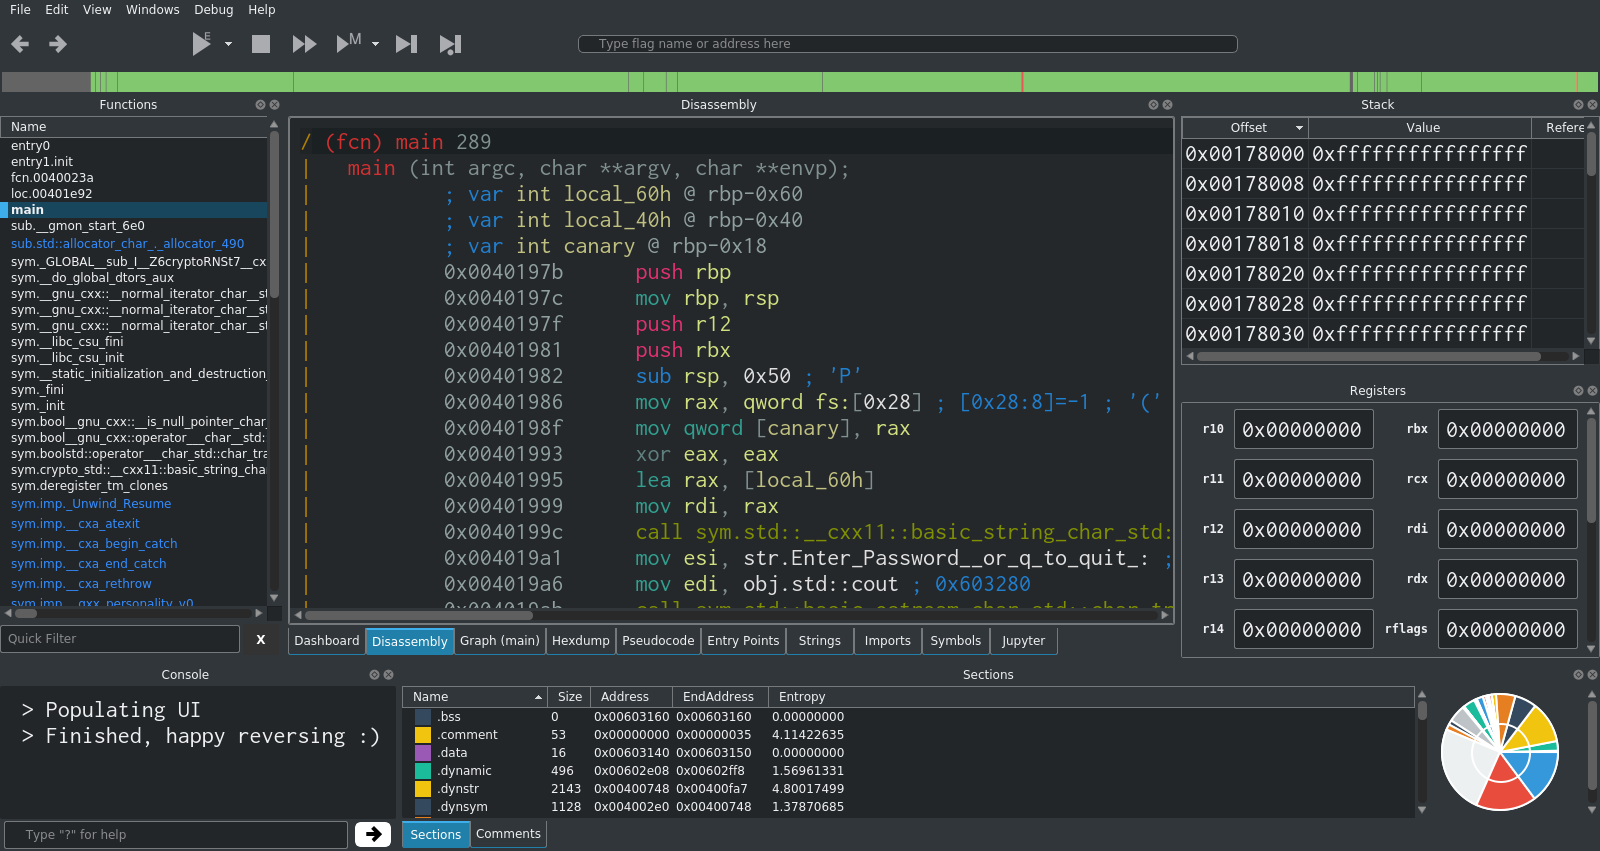
The main Cutter interface.
Skip to Section:
Introduction to Reverse Engineering with radare2 Cutter
Part 1: Key Terminology and Overview
┣━━ What are radare2 and Cutter?
┣━━ Installing Cutter
┣━━ Key Terminology
┃   ┣━━ Instruction
┃   ┣━━ Register
┃   ┣━━ Flag
┃   ┗━━ Stack
┣━━ Cutter Interface and Tools
┃   ┣━━ Dashboard
┃   ┣━━ Disassembly
┃   ┣━━ Graph
┃   ┣━━ Functions
┃   ┣━━ Strings
┃   ┣━━ Hexdump
┃   ┣━━ Pseudocode
┃   ┣━━ Entry Points
┃   ┣━━ Imports
┃   ┣━━ Symbols
┃   ┗━━ Jupyter Notebook
┣━━ Types of Analysis
┣━━ Crackme Challenges
┣━━ Sam's Crackme
┗━━ Part 2
What are radare2 and Cutter?
Radare2 is an open-source, command-line based reverse engineering framework for Linux, macOS, Windows and many other platforms. It includes a set of tools for reverse engineering and analysing executable files (compiled programs). Radare2 can be used to perform both static and dynamic analysis.
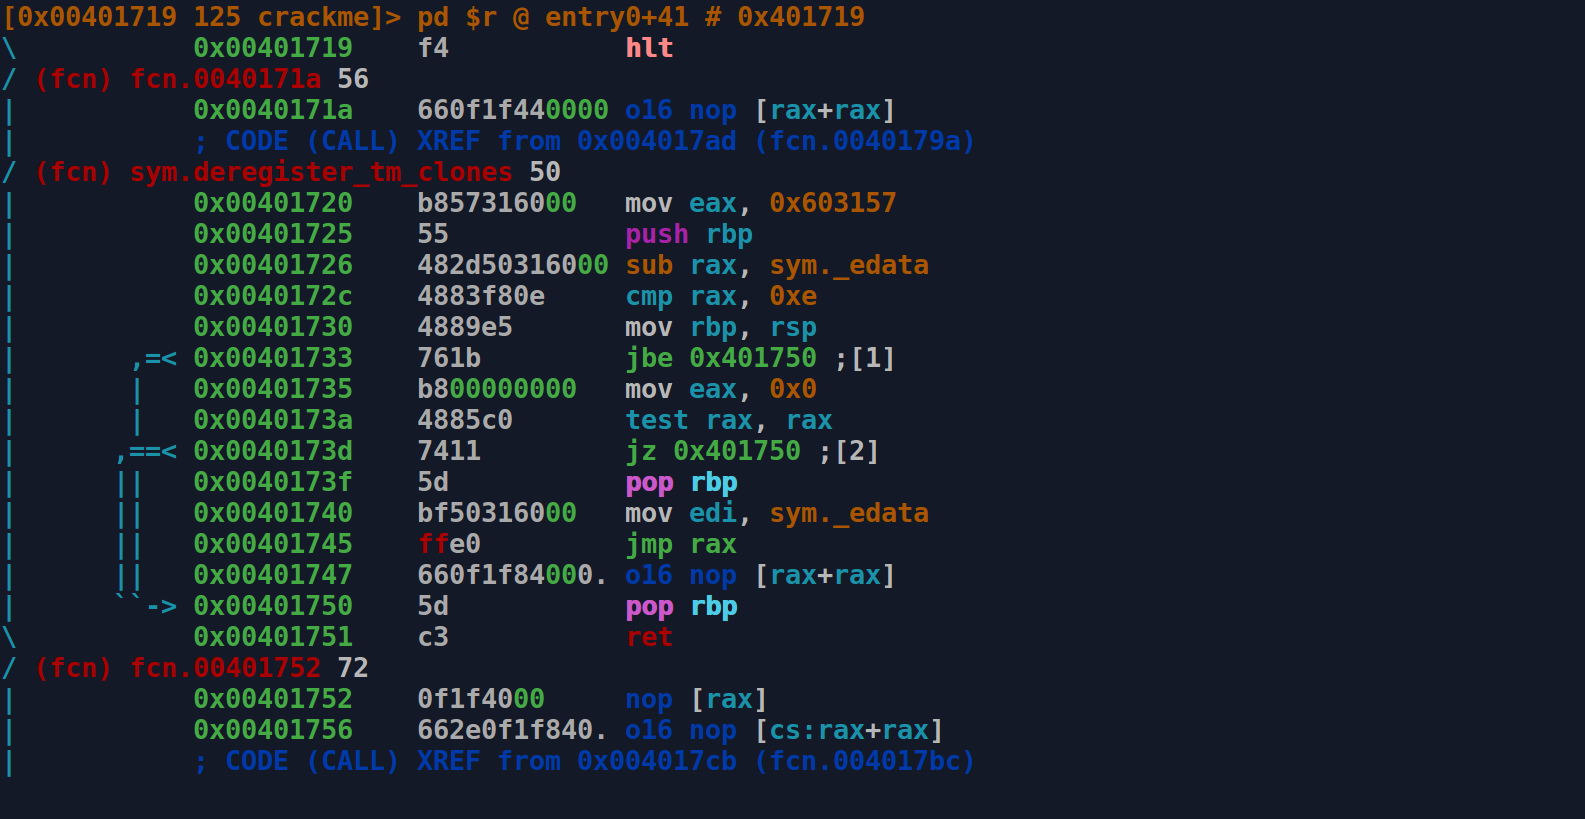
The radare2 command-line interface in disassembly view.
Cutter is the official GUI for radare2, allowing you to make use of all of the features of the command-line version while being able to better organise the information on your screen and make use of additional tools such as the built-in Jupyter notebook.
Development of Cutter, which was originally named Iaito, started in March 2017. Since then there have been 10 major releases, with the latest version at the time of writing being 1.7.2.
Installing Cutter
Cutter can be acquired in either source or binary form from the official GitHub repository: https://github.com/
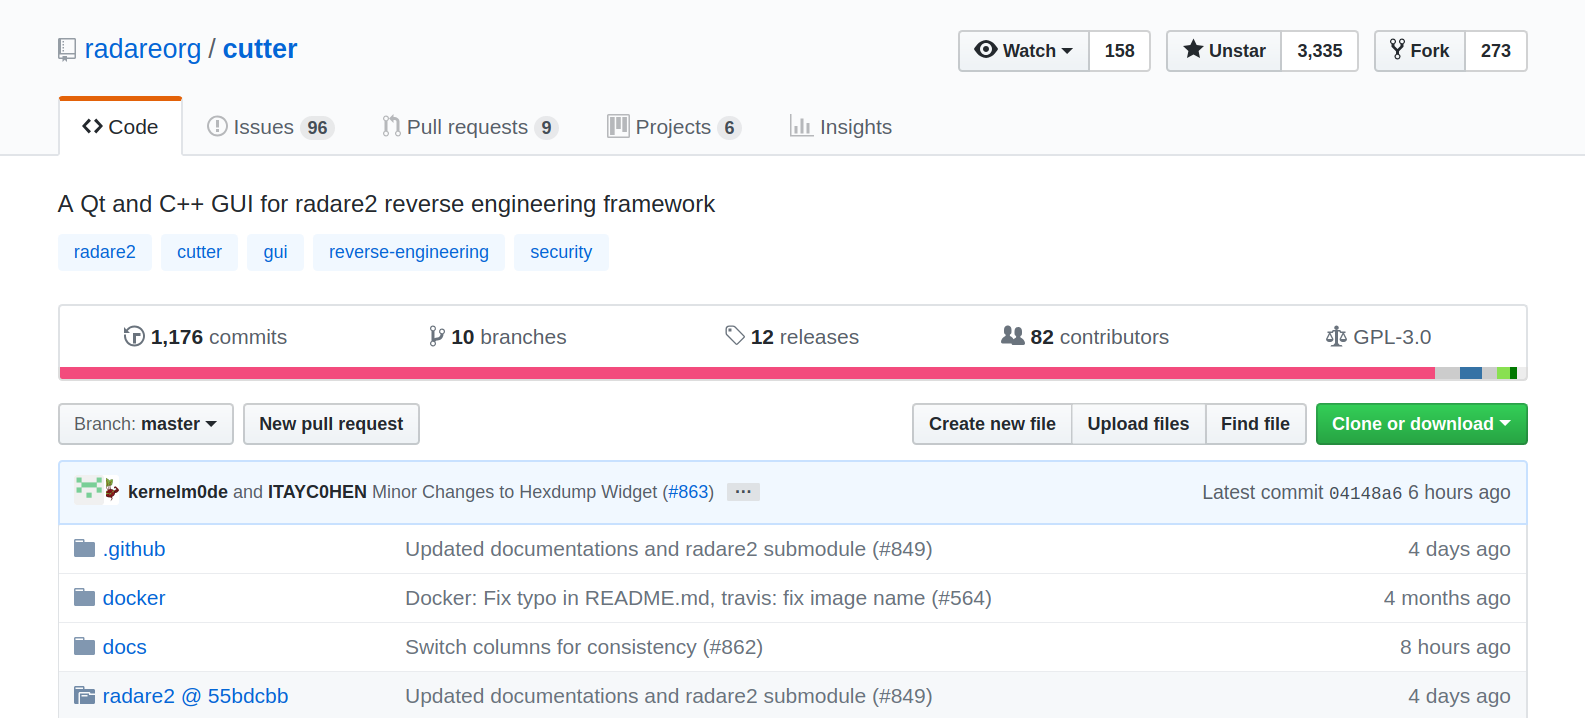
The radare2 Cutter project on GitHub.
Each release is available as an AppImage (for Linux), DMG (for macOS) and a ZIP containing an EXE (for Windows). The source code is also available if you to wish to compile Cutter yourself.
Unfortunately it's not easy to verify the integrity of the Cutter releases. I have opened an issue about this here.
Key Terminology
In order to begin with reverse engineering, there are few key bits of terminology that will come in useful.
Instruction
Instructions are used to perform very specific low-level tasks on the CPU. These tasks include manipulating memory, 'jumping' to a particular point in a program or performing binary operations.
Some examples of instructions include mov, call and jmp.
There are many different sets of instructions available, such as x86 or ARMv7.
Register
Registers are small amounts of fast memory present directly on the CPU. There are different amounts, types and sizes of registers depending on the CPU model and type.
Types of register include General Purpose Registers (of which there are 16 in x84_64), and the status register, which is used to store CPU flags.
Registers are addressed using names such as rax or rbx.
Flag
Flags are single-bit (i.e. 0 or 1) values that are used to store the current state of the CPU. They are stored in the status register, which is known as RFLAGS in x86_64 CPUs.
Some examples of flags include ZF (Zero Flag), which is set to 1 if the result of an arithmetic operation is 0, and CF (Carry Flag), which is used to indicate that an artithmetic operation requires a carry.
Stack
The stack is a part of the allocated memory (RAM) of a program used to store local variables and other key information related to the execution of the program or a function.
Data is pushed onto the stack in a last-in, first-out (LIFO) fashion.
Cutter Interface and Tools
Once you have downloaded Cutter (and installed if required), you can run it and choose a file to analyse.
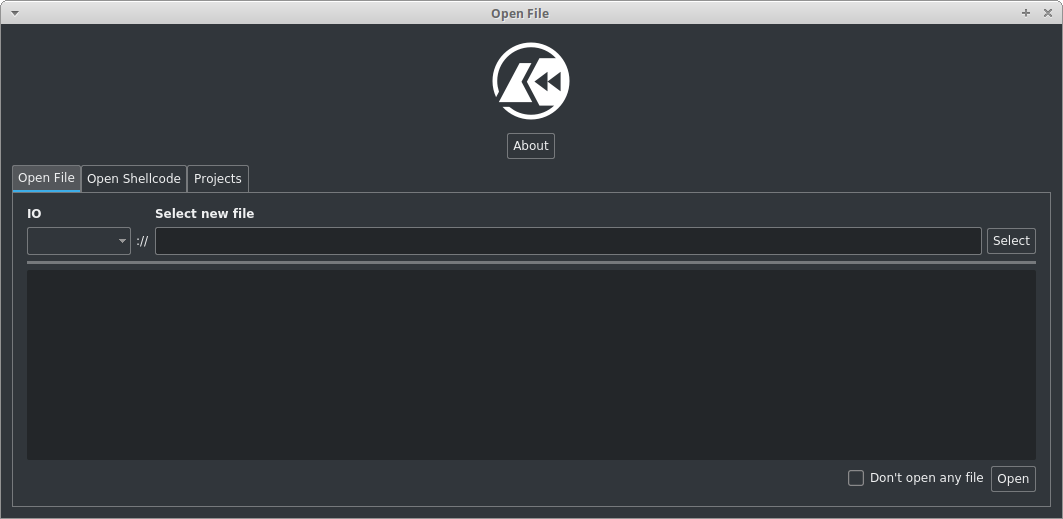
Choosing a file to open in Cutter.
If you just want to get Cutter working and analyse a file, a good starting choice could be a basic system tool/program such as pwd, true or whoami.
After selecting a file, Cutter will allow you to specify the analysis settings. In most cases, these can be left as the default.
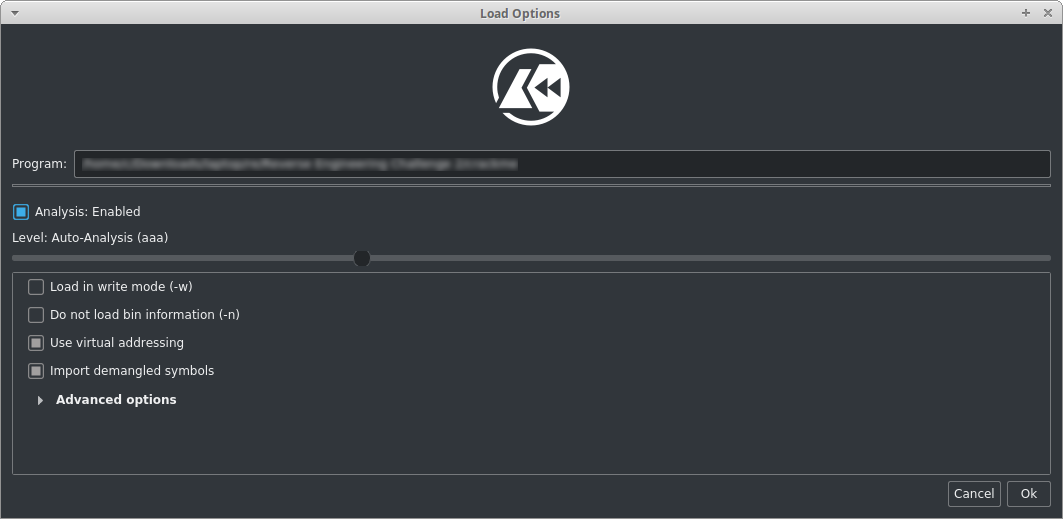
Choosing the analysis settings in Cutter.
After clicking 'Ok', Cutter will proceed to analyse the file and then the main Cutter interface will appear.
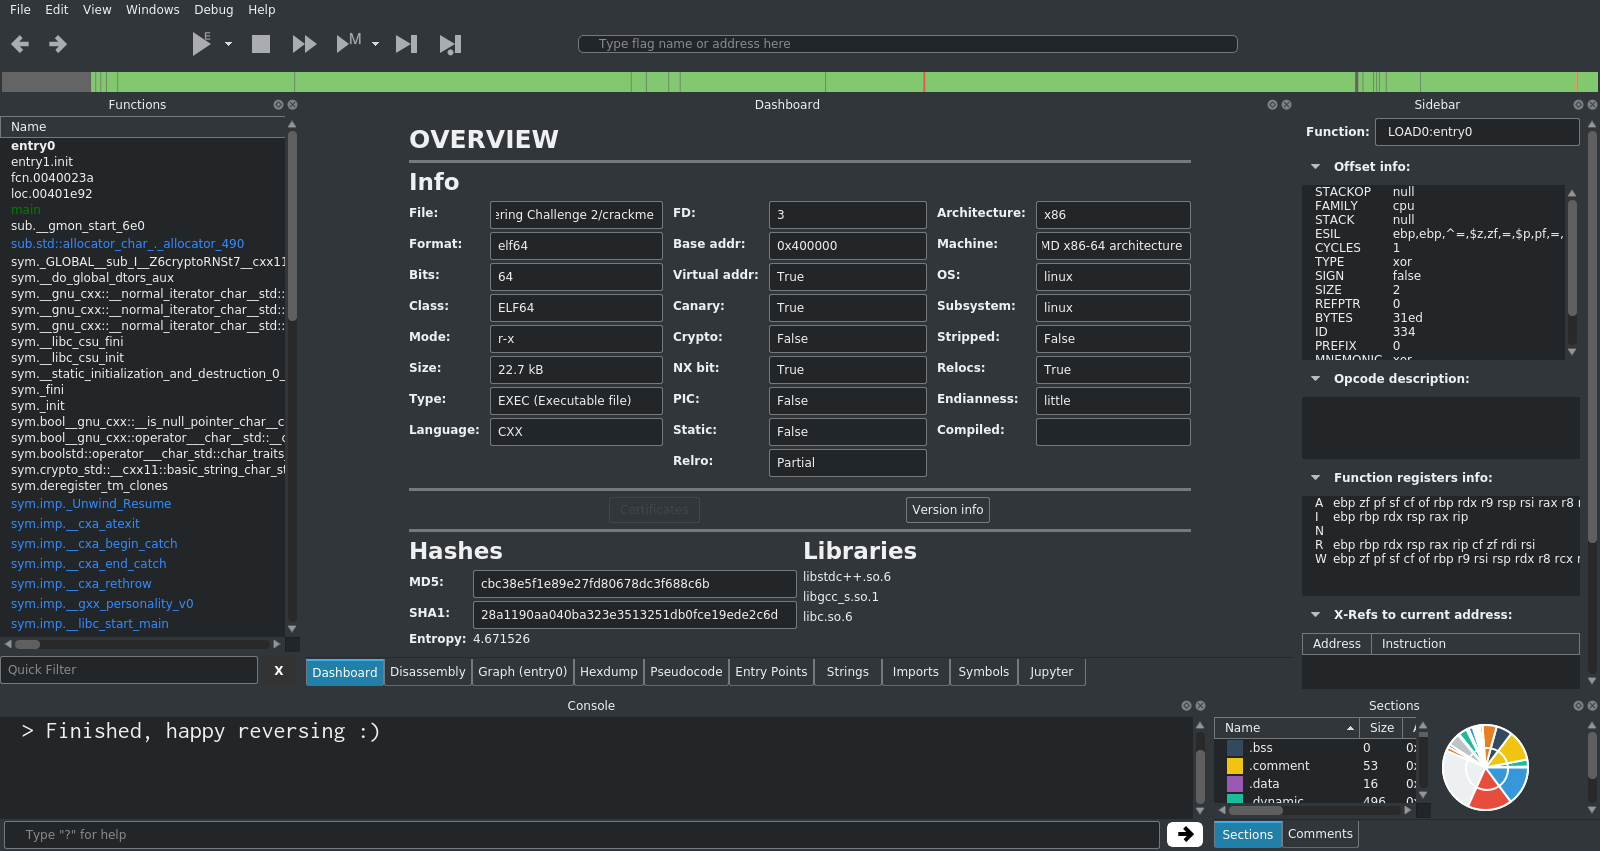
The default Cutter interface layout.
At first, this interface looks very daunting and may be overwhelming. There is lots of information being displayed and many menus available, however in most cases only a few sections and tools are actually needed.
The central panel with the tabs at the bottom is where most of your work will take place. The panels around the edge provide supporting information and other tools.
Dashboard
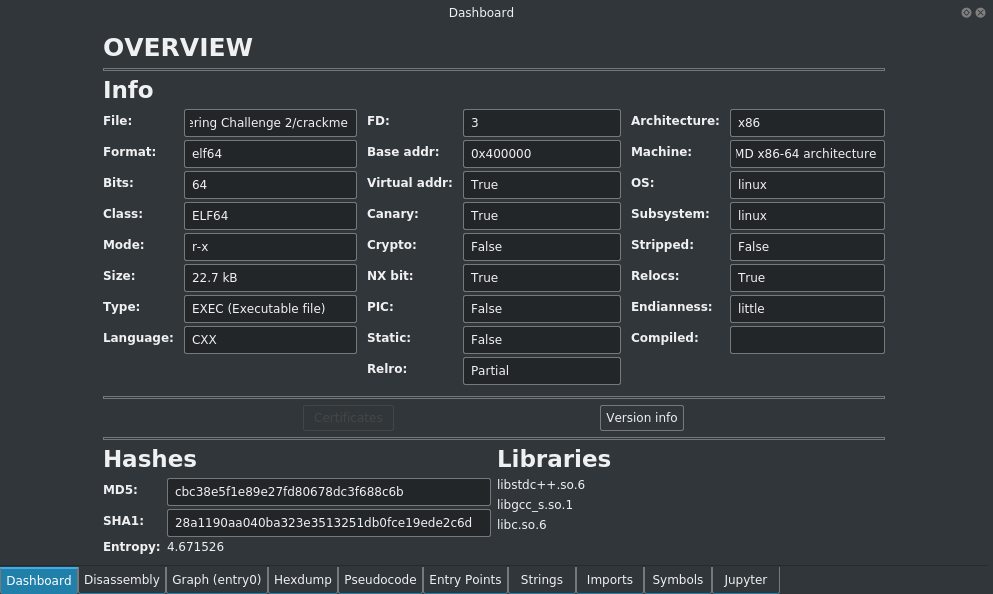
The dashboard tab contains an overview of the file that you are currently analysing, including the file format, size, architechture type and the libraries that it is using.
Disassembly
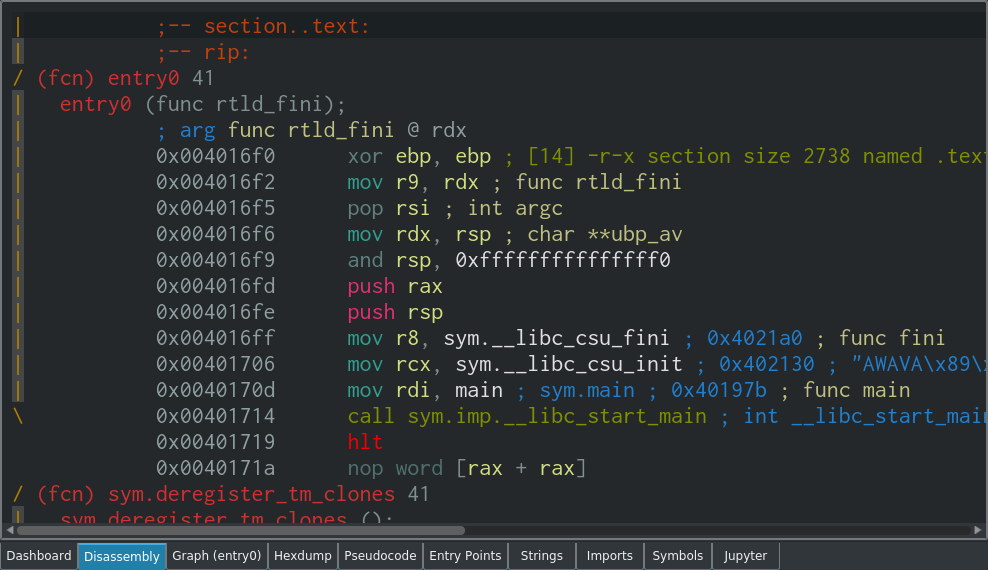
The disassembly panel shows the disassembled machine code of the program. This is known as assembly language, and contains raw instructions such as mov, push and call and the arguments that go along with them.
You can change the text size in the disassembly view using Ctrl + Shift + "+" (to increase) and Ctrl + "-" (to decrease).
In the x86_64 instruction set, there are a large number of unique instructions. The number varies depending on how you define an instruction, but it ranges from almost 1000 to significantly more than 1000. Stefan Heule has an interesting article on this if you're interested in how these numbers are calculated.
In practise though, only a small subset of these instructions are frequently seen. After a short while you will easily pick up the top 20 or 30 instructions, and this is all you will need for most analysis tasks. I have included a list of 'popular' instructions below for reference:
mov(Move) - Move data between registers and RAM.push(Push) - Push a value onto the stack.call(Call) - Call a procedure.ret(Return) - Return from a procedure.add(Add) - Add two values.cmp(Compare) - Compare two values.lea(Load Effective Address) - Load a memory address from source into destination.jmp(Jump) - Jump to the specified point in the program.jne(Jump Not Equal) - Jump if the previous test is not equal to zero.xor(Exclusive OR) - Perform a logical exclusive OR.hlt(Halt) - Stop instruction execution.
Most instructions require operands, which are essentially arguments to the instruction that define and modify its behaviour. For example in the mov instruction below, there are two operands, destination and source:
mov rbx, rax
The order of the operands depends on the syntax being used. In the Intel syntax, the first operand is the destination, and the second operand is the source:
mov destination, source
However, in the AT&T syntax, this is the other way around:
movq %rax, %rbx
You may also notice that there are additional differences between the Intel and AT&T syntaxes, such as the percentage sign in front of the operands and the mnemonic displaying as movq (Move Quadword, since rax and rbx are both full 64-bit registers), rather than just mov. In the case of 32-bit registers, the the movl (Move Doubleword) mnemonic would be shown.
Assembly language is difficult to read at first, and often there are many seemingly meaningless sections that get in the way of you finding the key part of the program that you are looking for. However, by using the tools available it is often possible to find the important bits quickly.
Graph
The graph view is used to visually display the process flow and execution paths available to the program. It's essentially a flowchart that maps out the program and all of the potential different ways that it can execute.
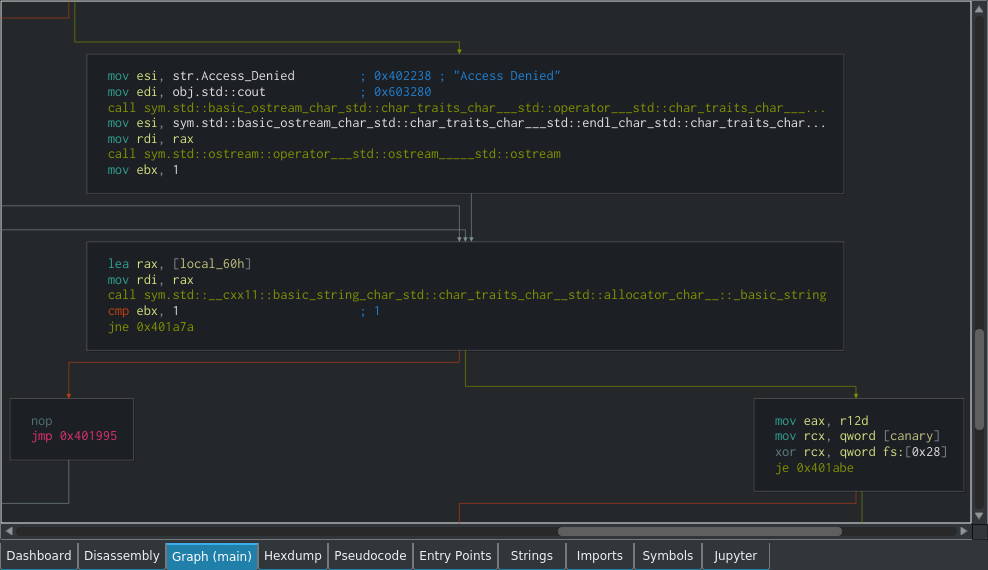
For example, in the event of a cmp (Compare) followed by one of the various jump instructions (which could be equivalent to an if statement in a higher-level language for simplicity's sake), there would be two arrows coming out and pointing to different parts of the program. One of these parts is what is executed if the if statement returns true, and the other would be for if it returns false.
The arrows are simply visual representations of the various jump instructions, such as jmp, jne or je. The green arrow shows what happens if the jump takes place, and the orange arrow shows what happens if it doesn't. Grey arrows show a loop.
The graph view can be moved around by clicking and dragging, and zoomed using Ctrl + Scroll Wheel. Double-clicking on any jump within the graph view will take you to the destination, and double-clicking an address will take you to that address in the disassesmbly view.
Functions
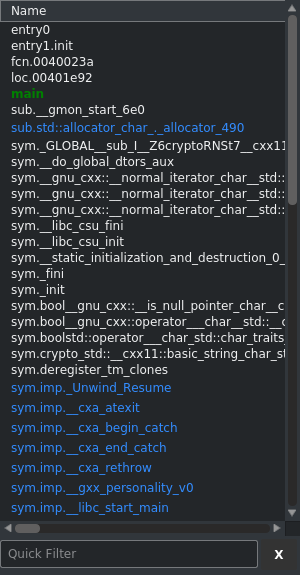
On the left hand side of the default interface layout, there is the functions list. This shows a list of functions that Cutter has been able to detect in the program.
Most often, the main function is where you will start your analysis, as this is the usually the start of the actual program that you're interested in, rather than the various libraries that are most likely included.
However, when analysing malware, it is important to keep in mind that malware authors often try to hide their code within standard libraries in order to make it more difficult to find using static analysis. It could be that main contains only legitimate/safe code, while the malware is actually hidden in a function from a standard library that you would usually ignore at first.
Strings
The strings view shows a stringdump of the binary that you are analysing. A stringdump shows text strings that have been found within the binary.
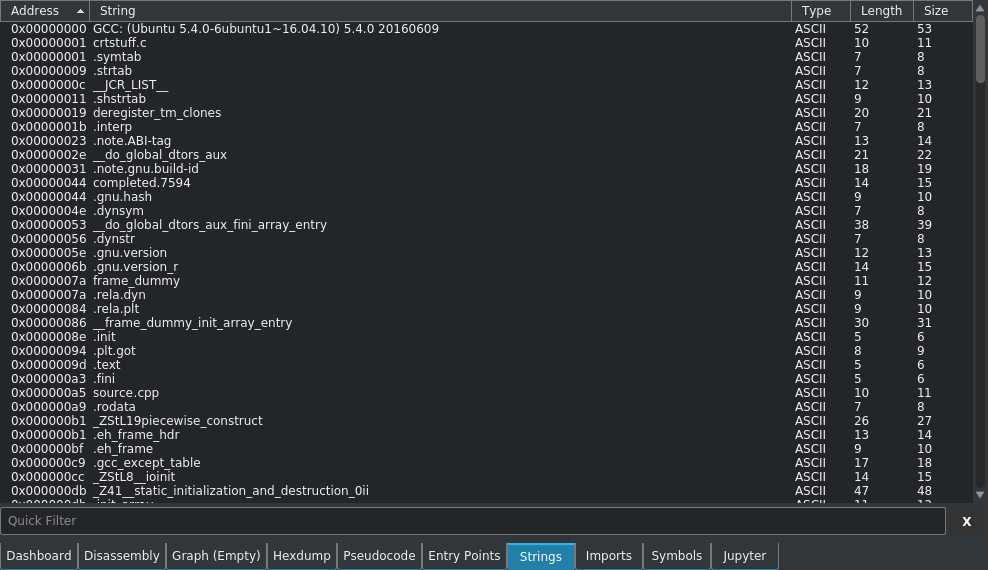
A stringdump will often give you a lot of clues about what the functionality and purpose of the binary is. Stringdump results are often your first lead when starting to analyse a new binary.
When analysing malware, strings may have been placed in order to throw you off-track, so make sure to keep this in mind.
Hexdump
The hexdump view shows a copy of the binary you are analysing in hexadecimal (base 16) form.
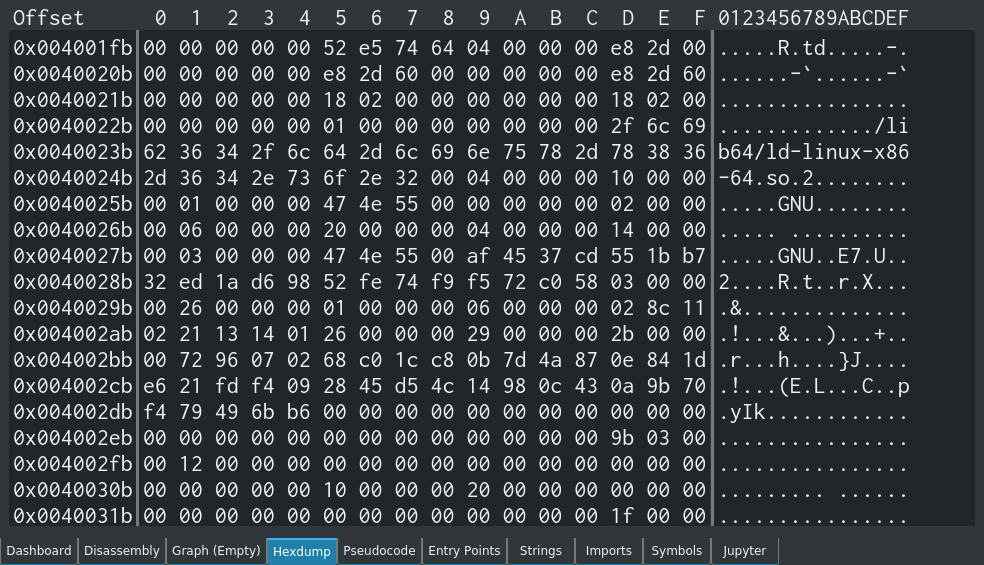
The first column is the offset, the second column is the hexadecimal output, and the third is the ASCII representation of the data.
The hex output is exactly the same as what you will get from the hexdump -vC command:
js@box:~$ hexdump -vC example.txt
00000000  54 68 65 20 71 75 69 63  6b 20 62 72 6f 77 6e 20  |The quick brown |
00000010  66 6f 78 20 6a 75 6d 70  73 20 6f 76 65 72 20 74  |fox jumps over t|
00000020  68 65 20 6c 61 7a 79 20  64 6f 67 2e 0a           |he lazy dog..|
0000002d
In many cases the raw hexdump view is not that useful in Cutter as the information is provided in better formats elsewhere in the program, however it's there if you need it.
Pseudocode
Cutter will attempt to display a pseudocode representation of the disassembled binary.
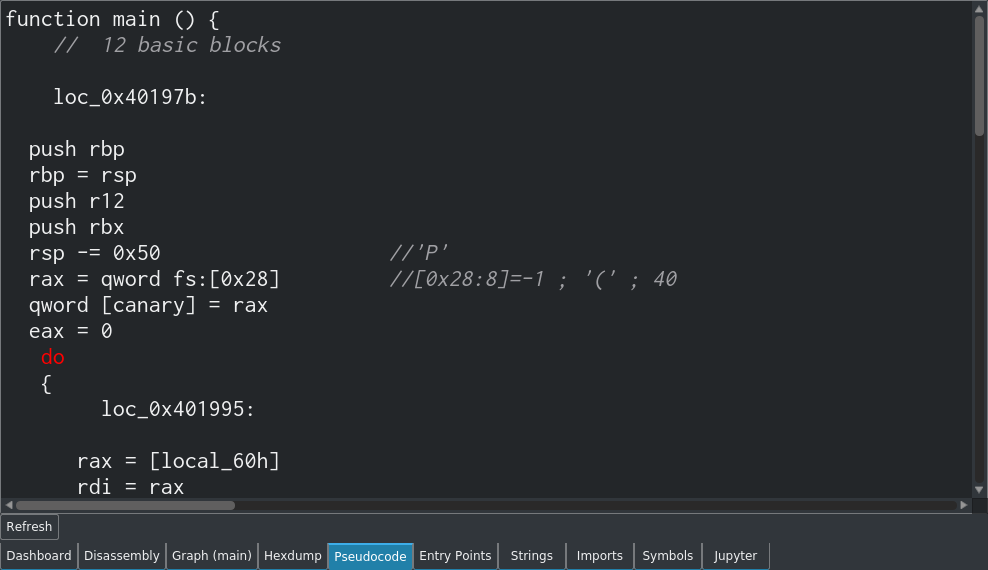
The indentation and formatting is often off though, which can make it confusing at first glance. In the example below, the way that the destination of the goto is represented as a do could be misleading at first. Additionally, you could mistake the while loop as being part of the if statement, whereas it really comes after the do:
...
r12d = 0
ebx = 0
goto 0x401a63
 do
 {
      loc_0x401a63:

    rax = [local_60h]
    rdi = rax
    sym.std::__cxx11::basic_string_char_std::char_traits_char__std::allocator_char__::_basic_string ()
    var = ebx - 1                 //1
    if (var) goto 0x401a7a        //likely
     } while (?);
return;
...
It also seems like the while loop doesn't actually do anything in this case.
I think that the pseudocode would be better presented like shown below:
...
r12d = 0
ebx = 0
goto 0x401a63
  do {                //loc_0x401a63:
    rax = [local_60h]
    rdi = rax
    sym.std::__cxx11::basic_string_char_std::char_traits_char__std::allocator_char__::_basic_string ()
    var = ebx - 1     //1
    if (var) {
      goto 0x401a7a   //likely
    }
  }
return;
...
Even though the pseudocode is not always accurate, this feature is still useful in some cases to help you (a human) understand the assembly code.
Also, I must mention that this is not a decompiler.
Entry Points
Cutter will detect and display the entry points of the program.

Entry points are where control is passed from the operating system to the program. Essentially it's the location in the binary that will be executed first when it is run.
Imports
The imports view displays a list of libraries that are imported by the binary that you are analysing.
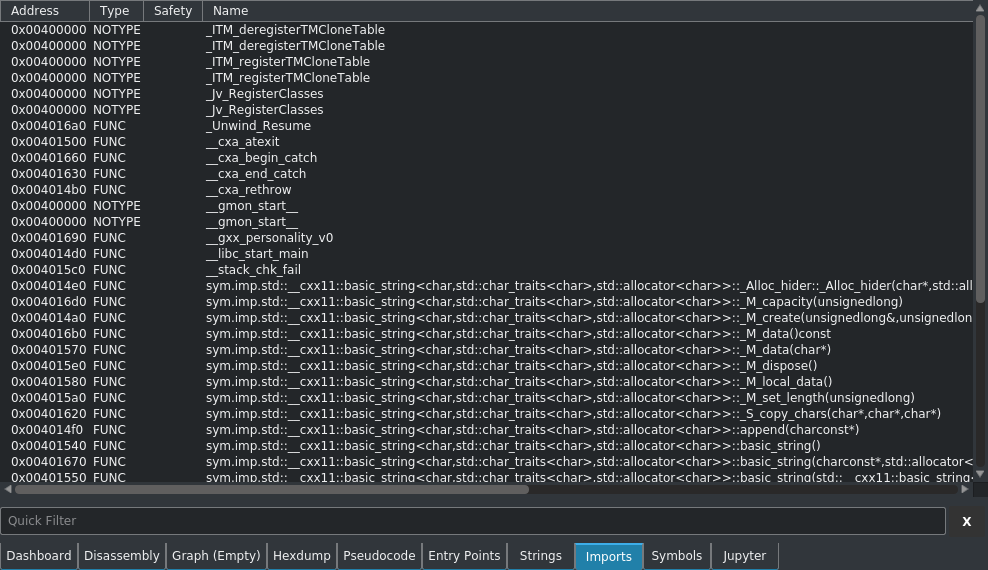
Symbols
The symbols view shows a list of the symbols from the symbol table of the binary that you analysing.
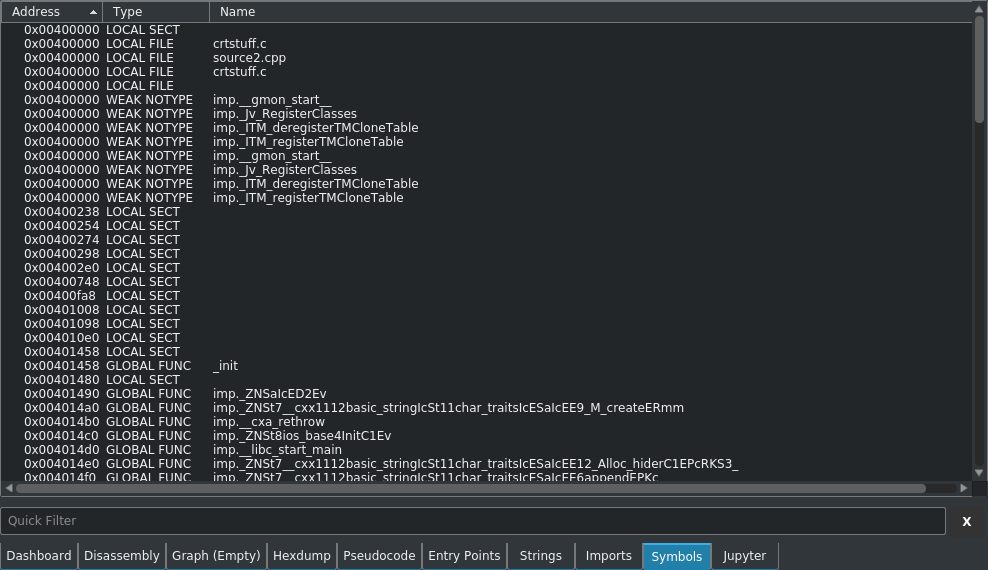
The symbol table contains information on various elements of the program, such as funtion names and entry points.
Jupyter Notebook
An additional feature of Cutter is the integrated Juptyer notebook.
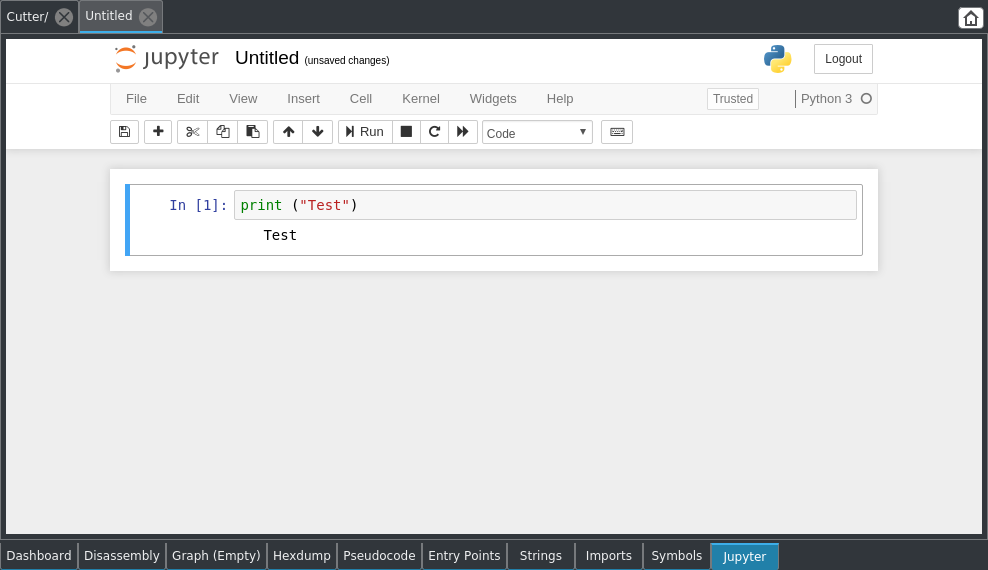
The Juptyer notebook is a server-based notebook application that supports both rich text and computer code. It allows you write and run Python directly in your notebook documents, which could be useful for many reverse engineering tasks.
I personally have not used the Jupyter notebook feature very much in Cutter, so I'm not aware of all of the features and whether it is useful or not.
Types of Analysis
Cutter is able to perform both static and dynamic analysis.
Static analysis is where you observe and analyse static information, such as the instructions, functions and strings present in a program.
Dynamic analysis is where the program is actually run and its behaviour is analysed. This could be done using an external debugger, virtual machine or by 'stepping through' the program one instruction at time (which can be done in Cutter).
Crackme Challenges
Possibly the best way to learn reverse engeering is to solve crackme challenges. Crackme challenges, or simply 'crackmes', are binaries that have been created for the purposes of training and testing your reverse engineering skills.
The most well-known type of crackme is a password crackme, which is a binary that prompts you for a password when run. In order to solve the crackme, you have to use various reverse engineering tools in order to determine what the password is.
Other types of crackmes include encryption programs where you have to reverse engineer an encryption key or algorithm, as well as programs with outright undefined behaviour, where you have to determine what the program does in order to solve the challenge.
Sometimes crackmes are run in a capture-the-flag (CTF) format, where you can submit the password or 'flag' that you have found to an online portal in order to receive points.
There are many places online where you can download crackmes, however always do your due-dilidence before downloading and running any due to the risk of malware, etc. I recommend using a dedicated and segregated malware analysis machine for downloading, running and analysing crackmes.
Sam's Crackme
In order to help with the process of learning Cutter, I asked my friend Sam to make a basic crackme challenge for me.
He kindly agreed, and put together a simple password-based crackme for me to solve.
The crackme looks like the following when run:
malw@re:~$ ./crackme
Enter Password (or q to quit): helloworld
Access Denied
Enter Password (or q to quit): Pa$$w0rd
Access Denied
Enter Password (or q to quit): q
I have already solved it and will be posting a walkthrough in part 3 of this series on my blog, however if you wish to have a go, it is available on GitHub here.
It is a beginner difficulty crackme, and most of the knowledge needed to solve it is present in the blog post that you are reading now.
Please note that the source.cpp file is not obfuscated, so looking at it will potentially reveal the solution. For the best experience, compile the code without looking at the source file. Obviously running untrusted code from the internet goes against every security best-practice out there, so either use a dedicated and segregated malware analysis machine, or ask a trusted friend to check the code first.
Part 2
Part 2 includes analysing a basic compiled C++ program using static analysis, and further technical details on some common instructions.